
Predicting the Number of Adverse Event Reports for Covid-19 Vaccine Batches
Predicting the Number of Adverse Event Reports for Covid-19 Vaccine Batches
A simplistic mathematical model for the reported adverse events


Abstract
A strong diversity in the number of adverse event reports in VAERS made some people wonder, if the manufacturers of Covid-19 vaccines were able to produce vaccine batches of constant quality or if even criminal intent was involved. In an article series, I analyzed the related reporting data and found a consistent explanation and provided evidence. You can read a short summary of my findings in the article ‘Bad Batch = Good Reporters?’, which also provides links to the three detailed articles.
I found out that the variety in the number of adverse events reports among batches was not necessarily the consequence of a different number of adverse events that occurred, but can be complained by a different ratio of events reported! I concluded that the data of only a few characteristics of the reports was sufficient to explain most of its number of reports.
For further evidence for my theory, I am working out models to predict the number of adverse event reports per batch and am going to describe them in this article. The idea is: Tell me some characteristics about the adverse event reports of a batch and I will tell you how many adverse events reports have been reported for it. These questions would be simple and general like: ‘At which date were most of its doses administered’? “What was the average age of the recipients?’ ‘What was the percentage of women?’ and ‘Which percentage of doses have been administered at a pharmacy?’
This is a mostly mathematical and more ‘nerdy’ article than usual, because of the nature of the underlying idea.
Approach
The evolution of batch reporting exhibited a significant change over time, developing from mostly erratic in phase 1 to relatively homogeneous in phase 2:
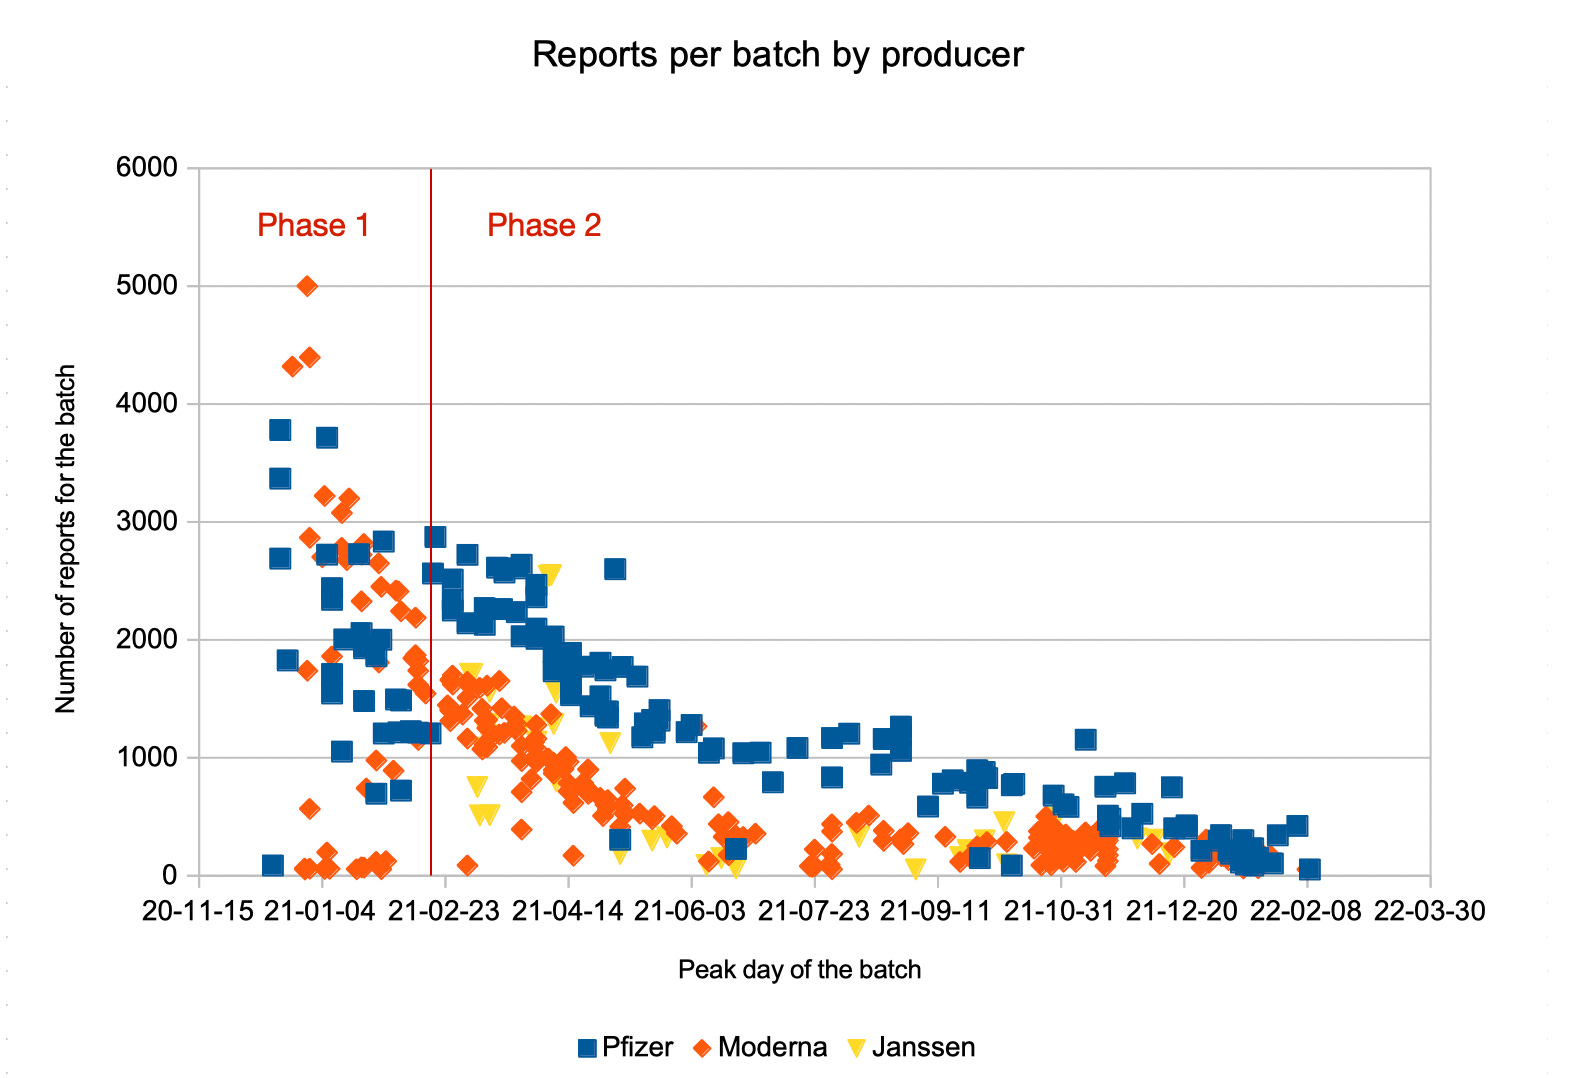
In phase 1, the number of reports was very different among different batches. In my article The Real Story behind the ‘Bad Batches’, I described this as a consequence of the COVID-19 Vaccine Priority Groups of vaccine rollout phase 1, with one of the three first priority groups (healthcare workers) having a much better health monitoring, thus a high reporting rate, and the number of reports for a batch determined by the percentage of healthcare workers vaccinated with it.
As of phase 2, report counts were much more similar and developed in a continuous manner, dominated by decay over time. Statistical analysis suggested choosing 02/18/2021 as the start date for phase 2.
In this article, I will use a linear approach to assess the factors with the strongest influence on reporting behavior. Obviously, I will need to assess the two phases separately. I will also add considerations of different batch sizes.
A simple approach and kind of a 'first-order-assessment' of the factors that contribute to the reporting rate is the use of solely linear dependencies. The resulting formula would look like
A(x,y,z) = a x + b y + c z + … + g
At first glance, it is obvious that the development over time is not linear but rather an exponential or 1/x decay, but let us start with this simple approach and see how far we get. If necessary, we can choose a more sophisticated approach.
Variables
First, let us have a look at the input variables I used and how to quantify them:
d: Date
d = number of days between 2020-12-14 (first public Covid-19 vaccination) and the peak date of a batch (the date which the largest number of administrations of that batch)
a: Age
In the former articles, I used the median age for my calculations, but this is an integer metric. It proved to be helpful to the average age as a decimal metric:
a = average age of the vaccinated people for which adverse events were reported in a batch.
f: Female Quota
f = quota of women/girls for which adverse events were reported in a batch (values 0 to 1).
Vaccination Site Quotas
p = quota of a batch's adverse event reports related to vaccination at a pharmacy (values 0 to 1)
w = quota of a batch's adverse event reports related to vaccination at the workplace (values 0 to 1)
Batch Size
v = number of vials in a batch
Adverse Event counts
The numbers of adverse event counts are denoted by A and S
A = number of adverse event reports per batch (ignoring pure administration errors)
S = number of severe adverse event reports per batch
Phase 2
Since Phase 2 was easier to asses, I am going to start with it.
As described in my article 'The Real Story behind the Bad Batches', by far the most important factor to determine the number of adverse event report counts per batch is the date.
I used a multilinear regression approach to estimate the influence of different factors. In the beginning, I fed it with all data available and meaningful, then I removed factor by factor until no more factor could be removed without severe deterioration of regression quality (measured by r^2 and p).
It turned out that the core factors for the number of adverse event reports in phase 2 are date, age, gender and vaccinations at a pharmacy:
A(d,a,f,p)
For the number of severe adverse event reports, only date and age are core factors:
S(d, a)
Pfizer/BioNTech
Adverse Events
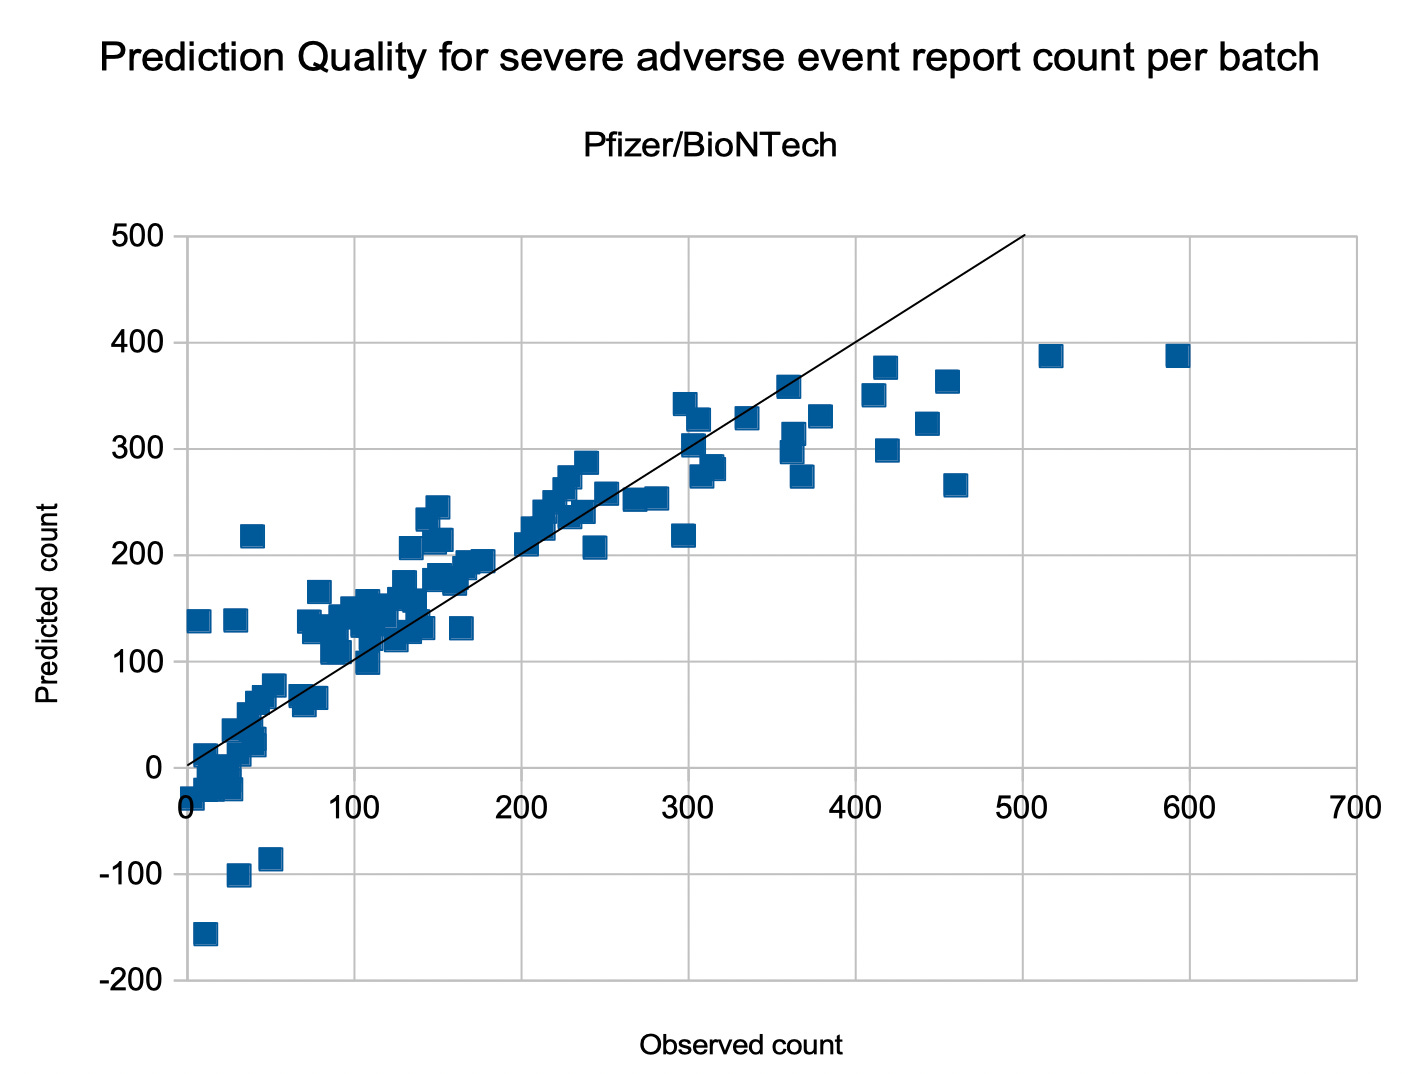
For Pfizer/BioNTech, the number of adverse event reports per batch in phase 2 can be predicted by
A(d,a,f,p) = –4.7566 d + 13.756 a – 607.29 f – 815.72 p + 2,386
with a pretty good quality: r^2 = 0.8564 and p < 0.00001.
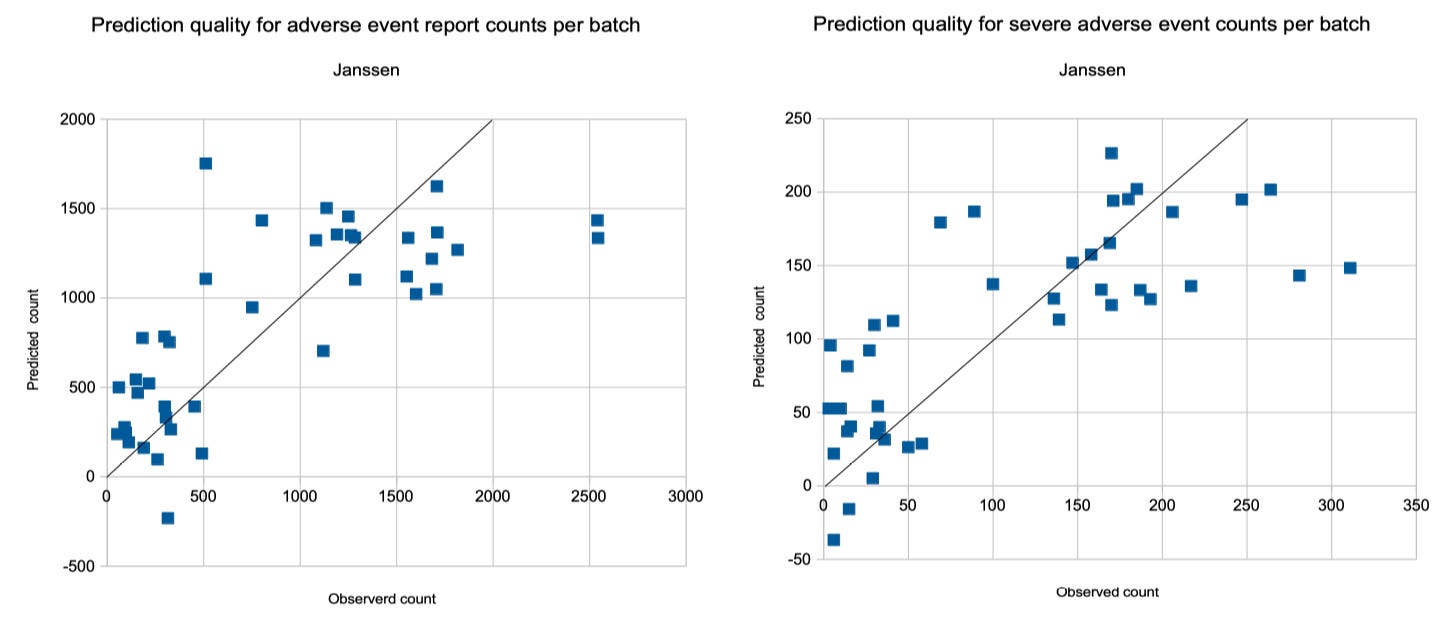
The prediction quality is assessed in the following diagram, depicting the predicted number of adverse event reports over the number of observed adverse event reports. With an ideal prediction, all points would be along the black identity line.

The following insights apply for all the following formulas, except for Janssen: The diagram shows a pretty good prediction quality, only a few points have a bigger distance to the identity line. Even the deviations of the point cloud from the identity line look regular and mainly are a consequence of the fact that the dependency on time is not linear. The formula presented above does not take individual lot sizes into account and, because of the overall quality of these predictions, we can assume that only a few batches might have a significantly smaller or larger number of doses that the average. The bigger deviations of the batches with a large number of reports might be remainders of phase 1, in which batches had a wider diversity of batch sizes.
Severe Adverse Events
The number of severe adverse event reports for a Pfizer/BioNTech batch in phase 2 can be predicted by the formula
S(d,a) = –0.7808 d + 5.1871 a + 116.3010
with a quality of 78% (r^2 = 0.7856 and p < 0.00001).
Moderna
Adverse Events
For Moderna, the number of adverse event reports per batch in phase 2 can be predicted by
A(d,a,f,p) = –2.4967 d + 20.985 a + 1,475.6 f – 523.55 p – 648
with a quality of 82% (r^2 = 0.8285, p < 0.00001).
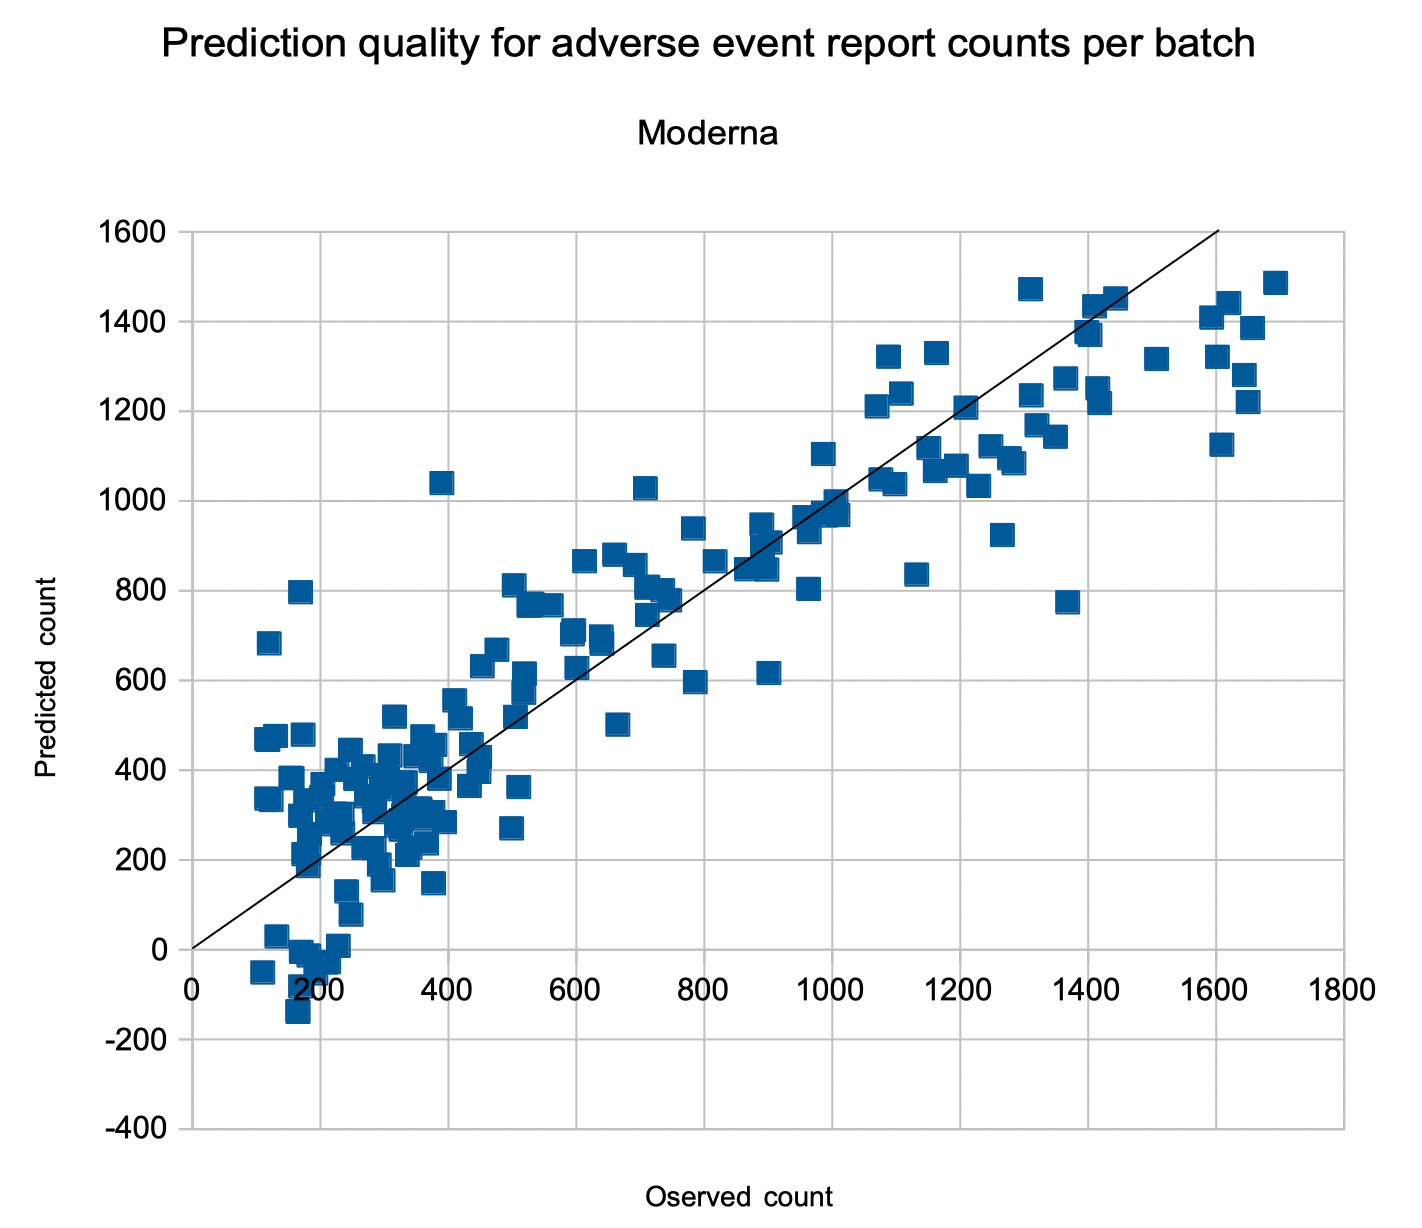
The prediction quality check has a wider distribution than for Pfizer, but looks well-behaved, too. Partially, this can be explained with Moderna's smaller batch size which results in stronger effects of statistical noise.
Severe Adverse Events
The number of severe adverse event reports for a Pfizer/BioNTech batch in phase 2 can be predicted by the formula
S(d,a) = –0.3516 d + 3.8102 a – 47.0314
with a quality of 72% (r^2 = 0.772 and p < 0.00001).
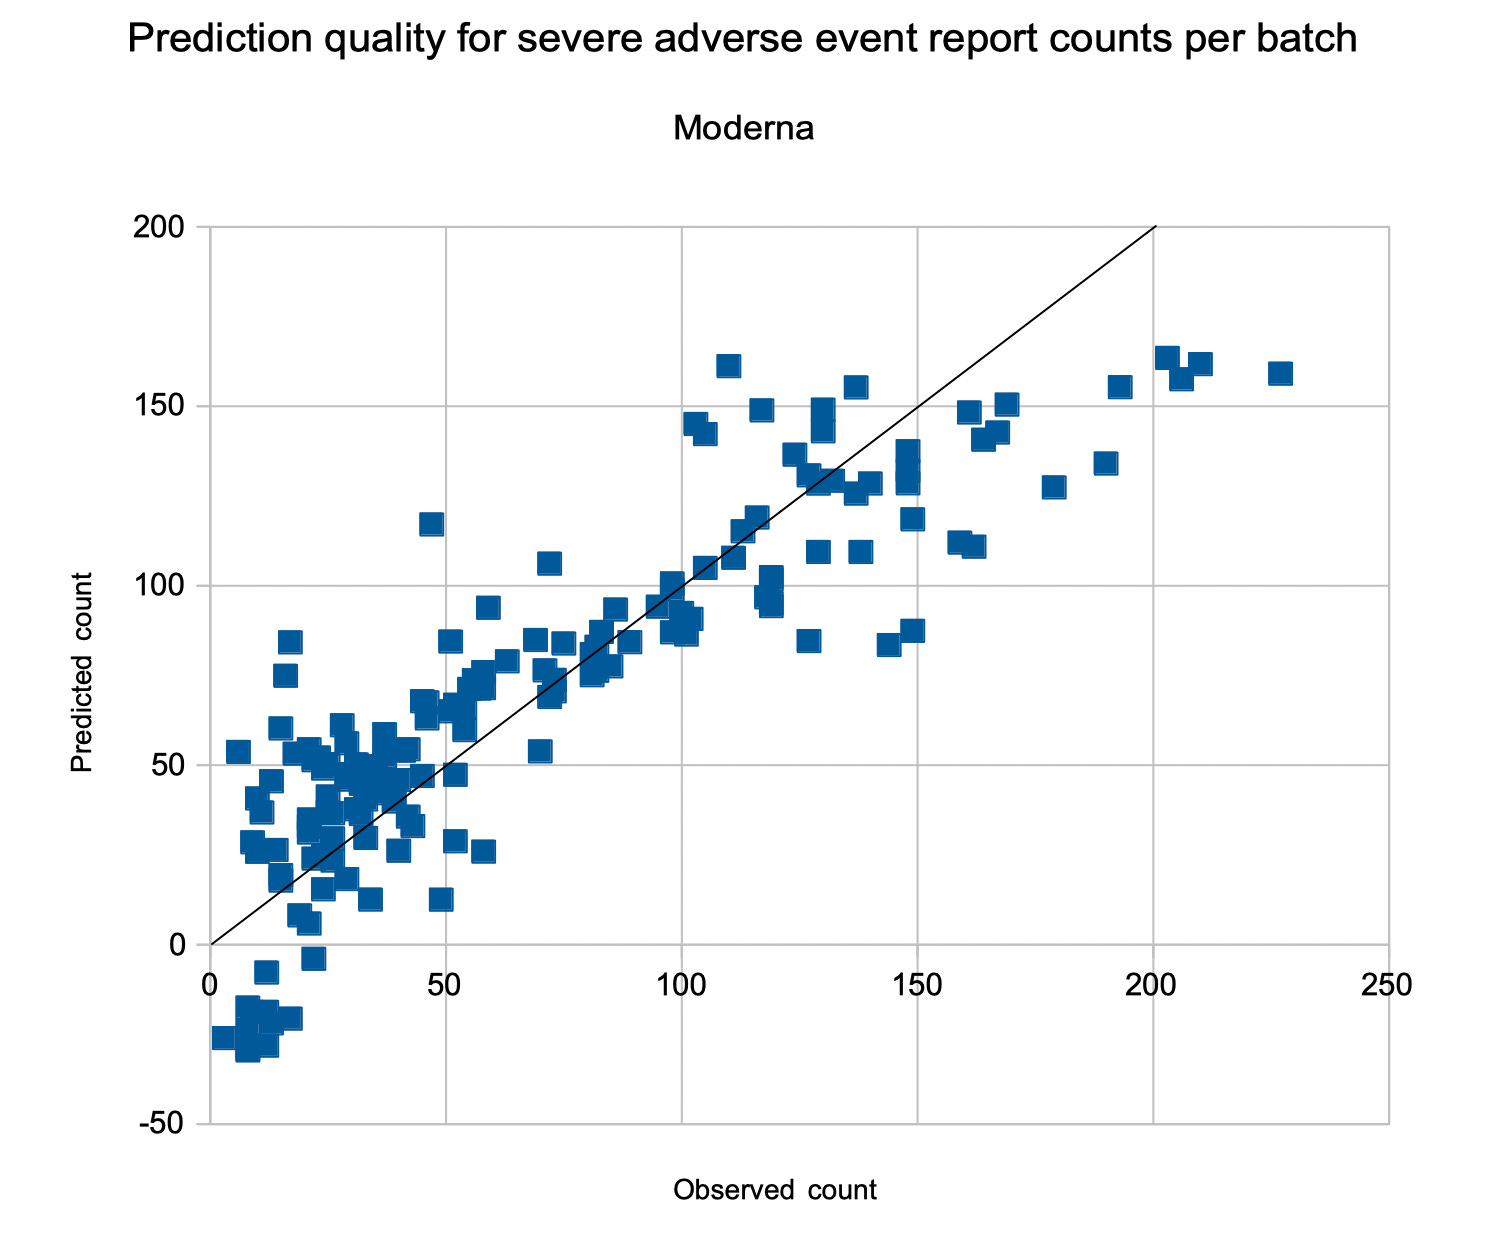
The fact that the number of severe adverse events is much smaller than the number of adverse events assessed above does not deteriorate the prediction quality too much.
Janssen
The analysis of Janssen's adverse event reports is deluding: Its dataset is much smaller and has a much bigger variety and the regression results have a much lower quality. If I was told that one of these three manufacturers had production quality issues and would be asked to guess which one, then I would guess Janssen. Since the results have poor quality, I provide them just for completeness and do not further comment on them:
Adverse Events and Severe Adverse Events
For Janssen, the number of adverse event reports per batch in phase 2 can be predicted by
A(d,a,f) = –2.7785 d – 60.2817 a + 5,736.5 f + 950
The quota of administrations at a pharmacy is not relevant and the quality is only 54% (r^2 = 0.5482 and p < 0.00001).
The number of severe adverse event report for a Pfizer/BioNTech batch in phase 2 can be predicted by the formula
S(d,a) = –0.5317 d + 6.1344 a – 71.5066
with a quality of 57% (r^2 = 0.5793, p < 0.00001)
Vaccine Rollout Phase 1
In my article 'The Real Story behind the Bad Batches', I explained phase 1 reporting behavior with the effects of the Covid vaccine priority groups but did not yet find a satisfactory way to quantify it. It was unclear, how to assess the quota of the different groups in phase 1 and all logical and empirical approaches failed.
But new information has arrived: The website 'How bad is my batch?' provides a Pfizer document at the link ‘Download Source Code’: The document is 'COVID-19 Vaccine (BNT162, PF-07302048) BB-IND 19736'. On pages 23–25, it lists some Pfizer lot numbers with their number of vials and provides the missing link for an assessment of some batches in phase 1.
The listed lot sizes differed by a factor of up to two and factoring in this information, it turned out how to assess the priority groups: Quota of vaccinations at the workplace.
Pfizer/BioNTech
For Pfizer/BioNTech, the number of adverse event reports per batch in phase 2 can be predicted with a function of a (average age), w (vaccination at the workplace) and v (the number of vials per batch):
A(a,w,v) = (-2.0674 a + -139.34 w + 127.98) * v / 1000
with an outstanding quality of 93% (r^2 = 0.9343 and p < 0.00001)

For the prediction of the number of severe adverse events S, I did not find a satisfactory good formula.
Visual Assessment of Prediction Quality
Let us assess the quality of the prediction formulas visually by comparing the reported adverse event counts on the left with the predicted adverse event counts on the right. First, in the upper row, for all adverse events, then, in the lower row, for the severe adverse events only. Pfizer/BioNTech batches are displayed with blue squares, Moderna batches with orange diamonds and Janssen batches with yellow triangles:
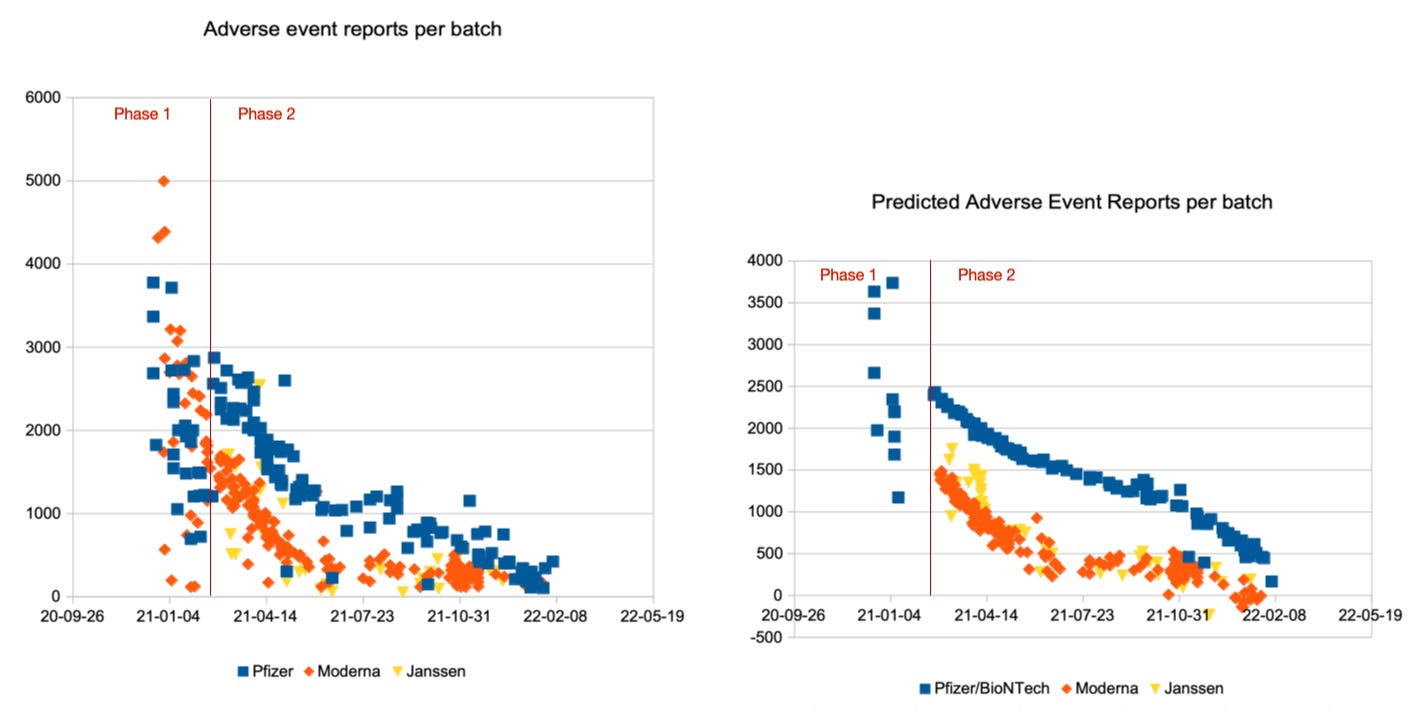
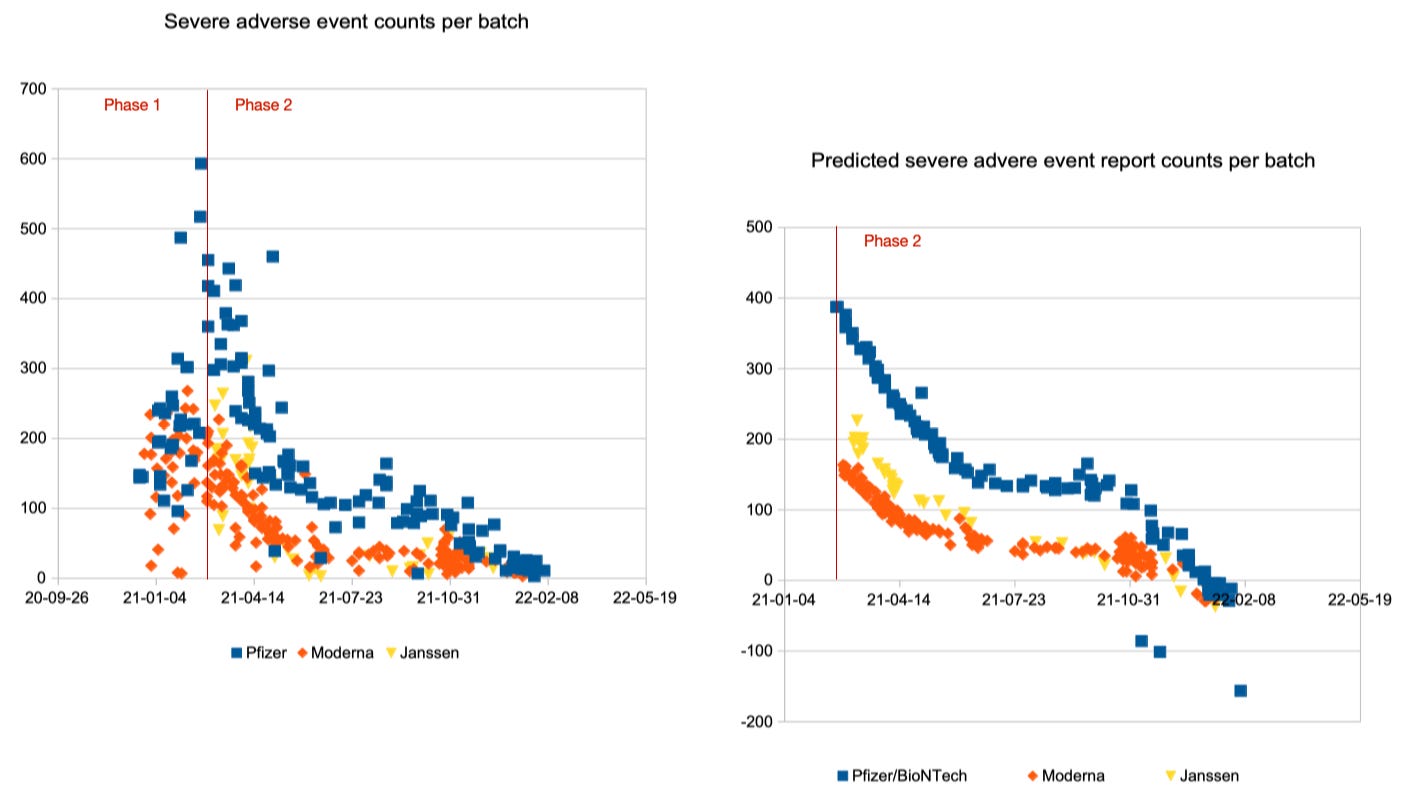
Overall, this looks pretty good. Strong deviations are mainly observed in the transition period between phase 1 and phase 2, probably because a sharp distinction date is not legitimate. As of February 2022, the report count estimates approach negative territory, but this is due to the chosen linear approach.
Conclusions
I am surprised for myself, but for a simplistic approach of equal batch size in phase 2 and a linear function, the results look outstanding. The total numbers of adverse event reports per batch look quite well behaved. However, for phase 1, I did not find a satisfactory formula for severe adverse event report counts, which may be due to the low number of batches (11) for which the number of vials was provided – or might have explications in unknown factors like long storage times before product admission and administration. For the Moderna and Janssen batches, I have no batch size information at all.
Overall, there is more and more evidence for my theory, and I will have a closer look at its implications and the possible extrapolation to total adverse event counts in a future article, after reconsidering the batch sizes.
Stay healthy in mind, never stop asking,
Leonard Frey
(Pseudonym)